Definitions Of Long, Short, Bullish, And Bearish
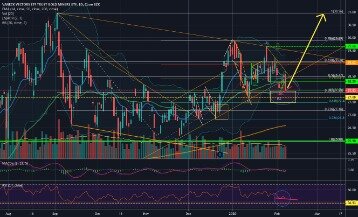
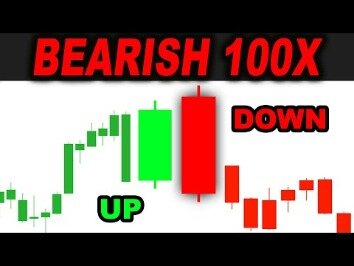
This is the same JP Morgan chart from the previous example, but this time we have placed a stop loss order below the bullish stick sandwich candlestick pattern. Now, shifting gears back to our stick sandwich candlestick pattern. Since it is a three-c...